

1. Managing the collection of data – an overview
Hello and thank you to you and your school for agreeing to collect learning behaviour data and contextual data on all of your year 6 students.
Here’s a quick summary of what you’ll need to do at whole school level:
- Identify someone who will oversee the collection of data – maybe a senior leader or one of your year 6 team
- Download a copy of the master spreadsheet (see opposite)
- Make a copy of this spreadsheet for each of your year 6 classes
- Help year 6 teachers to complete the spreadsheet for their class (see sections 2 and 3 below)
- Collate the class spreadsheets into one master spreadsheet (section 4)
- Send your completed master spreadsheet to TLO for detailed analysis (section 5).
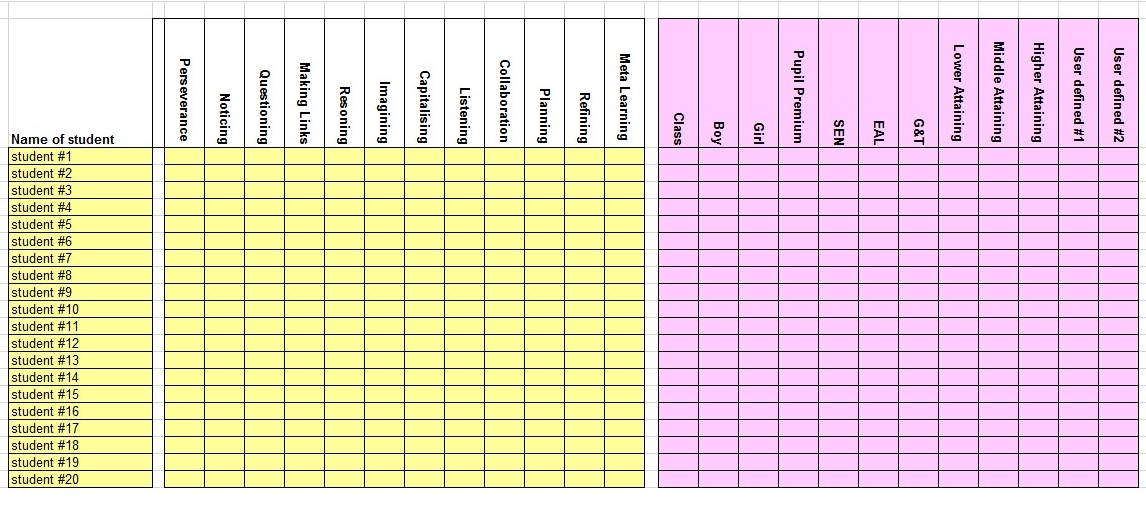
Download your master copy of the spreadsheet –
Master Copy Download Here
Rename it and save it to your hard drive.
Make sufficient (re-named) copies of this sheet, one for each of your year 6 classes.
2. Gathering learning behaviour data
Each Year 6 teacher should:
- Download and print a copy of the learning chart (opposite) for each of their year 6 students.
[Hint – It is better to use the A3 option if you have an A3 printer.
If not, use the A4 option which prints the chart over 2 A4 sheets.]
- For each student in your class, colour in cells in the chart that describe the student’s secure learning behaviours.
- the colours of the rows carry a meaning linked to students’ attitudes and emotions. If you need a quick reminder take a look at the table in the toggle box below.
- If you’re unsure about what constitutes secure behaviour, read section 2a (below) for further information.
- Start at the foot of each column and work upwards, stopping once the behaviours described are clearly beyond the student’s current skill set.
If you need more detail on how to go about this, go to sections 2 and 3 of the full, online Narrowing the Learning Gaps resource.

The phases of growth chart ⬇️
Meaning behind the phases of growth
The phases are drawn from Bloom’s taxonomy of the affective domain.
Phase 1 ‘Lacks’ (grey) In this ‘Lacks’ (grey) phase, students are minded to give up easily. There are all sorts of reasons for this; they may just be constantly distracted from the activity in hand; they may just need constant adult support; they may not know what might help them. Many students will need to be eased into learning how to learn in a classroom setting. A straightforward way to understand this phase is when students tend to say ‘I can’t’ or ‘I won’t’
Phase ‘Receives’ (purple) learners are beginning to explore the behaviour and are moving from a negative to a neutral mindset, often employing the skill or doing something because they are being told to or expected to. A straightforward way to understand this phase is when students tend to say ‘Show me’ or ‘Tell me’
Phase ‘Responds’ (blue) is about gaining interest and doing things more willingly, building the skills and the willingness to deploy them. A straightforward way to understand this phase is when students tend to say ‘I’ll try’.
Phase ‘Values’ (green) is a key phase since the student now sees the value of behaving in this way. It’s a win for them; to behave like this is in their interest. It’s in this phase that the behaviour becomes more secure. A straightforward way to understand this phase is when students tend to say ‘I see why’
Phase ‘Organises’ (yellow) is the phase in which the student capitalises on this ‘in their interest’ behaviour and gets themselves organised to use it positively. A straightforward way to understand this phase is when students tend to say ‘I make sure I do’
Phase ‘Embodies’ (orange), In this phase the student has made this behaviour their own. It has become part of their character; they can’t not do it and they have become highly skilled in doing it. A straightforward way to understand this phase is when students tend to say ‘I can’t not do this’
We urge you to see this progression as long term. Some phases will take years for people to work through; some will never be worked through. None of the phases are inevitable. There is a lifetime of development captured here. Nevertheless your role as a teacher or parent should surely be to encourage and enable this journey.
IF YOU WANT THE CHART ITSELF, I DON’T HAVE IT IN A COPYABLE FORMAT
2a. What is a ‘secure’ behaviour?
For each cell in the learning chart, ask yourself;
- ‘is the student like this in most circumstances – does the cell describe what they usually do?’
- If yes, colour the cell.
- If no, or if they only do it occasionally, leave the cell blank.
So – ‘secure’ means ‘they can do this and they do do this’.

2b. Creating learning behaviour ‘scores’
Once the learning charts have been completed to show a ‘learning profile’ for each student, it is time to convert that ‘profile’ into a ‘score’.
Consider each column in turn:
- Score zero if nothing is coloured in or the very bottom row (the Grey phase) is coloured in;
- Score 1 for each of the coloured-in cells in the purple, blue and green phases;
- Score 2 for each of the coloured-in cells in the yellow or gold phases.
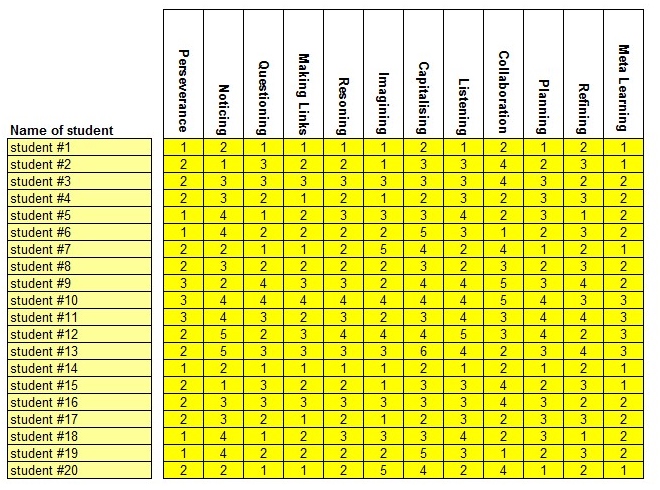
For example, the ‘score’ for the learning profile opposite would be 2:2:0:4:5:5:8:6:3:10:1:3.
For each student, you will end up with 12 ‘scores’, one for each of the 12 learning behaviours.
Record each student’s ‘scores’ in the bottom row of the learning chart.

2c. Entering learning behaviour ‘scores’ on the class spreadsheet
Once you have created learning behaviour ‘scores’ for all of the students in your class, open the spreadsheet for your class.
For each student, enter their name in column B, and transfer their 12 ‘scores’ into columns D to O.
Save the file.
3. Gathering the contextual data
The contextual data may well be things that the class teacher already knows, or perhaps this data will be generated from your admin system.
In either case, proceed as follows :-
On the class spreadsheet, find the tab at the bottom called ‘contextual print only’.
This tab cannot be edited, but you can print it so that you can record your contextual data. If you have completed step 2c (above), your print-out will already be populated with your students’ names.
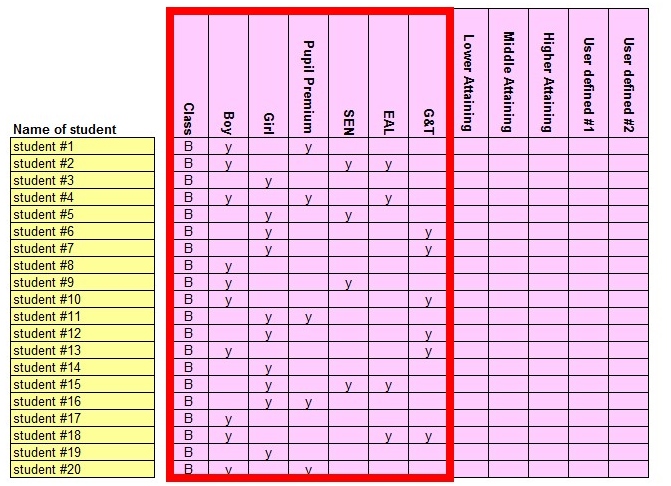
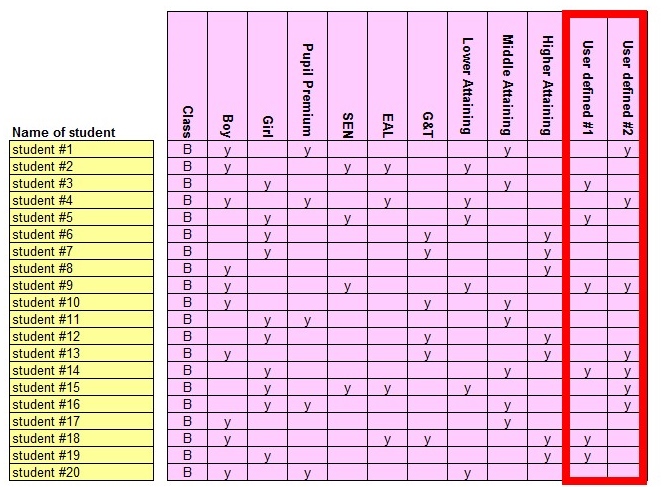
Firstly, add the basic contextual information that the class teacher will already know:
- Class Code: a unique identifier for the student’s class. You can use any symbols you like here, so if your class is called 6 Beech, use ‘B’ etc. Just be sure that no other year 6 class is using the same code;
- Boy: enter ‘y’ if a boy, leave blank if a girl;
- Girl: enter ‘y’ if a girl, leave blank if a boy;
- Pupil Premium: enter a ‘y’ if the student attracts PP funding, leave blank if not;
- SEN: enter a ‘y’ if the student is on your special needs register, leave blank if not;
- EAL: enter a ‘y’ if the student has English as an Additional Language, leave blank if not;
- G&T: enter a ‘y’ if the student is identified as being Gifted and Talented, leave blank if not;
This data goes into the first 7 columns of the grid (see opposite).
3a. Considerations in relation to ‘lower / middle / higher’ attainment
Entering the attainment data:
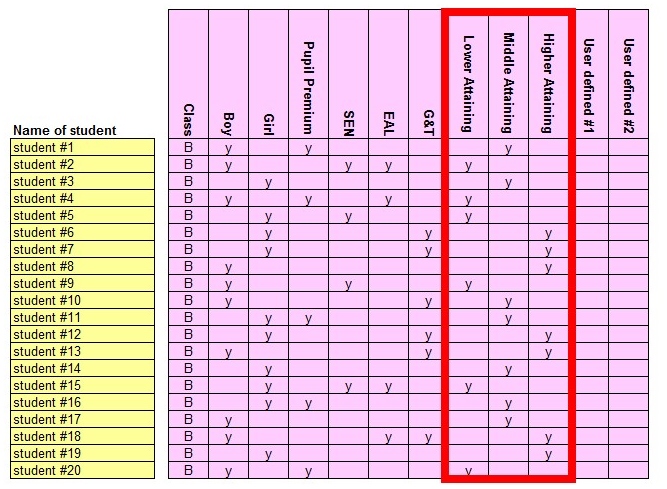
Lower / Middle / Higher attaining: enter a ‘y’ in just one of these 3 columns, and leave the other 2 columns blank (but read below for guidance)
Guidance:
This step almost certainly requires to be coordinated centrally. You are aiming to split your entire year 6 cohort into three evenly balanced groups – the lower attaining third, the middle attaining third, and the higher attaining third.
- No need to be too precise – plus or minus one or 2 students either way will not matter.
- Whoever is overseeing the collection of data will need to consider how this can be most easily achieved.
- Do you have centrally held attainment data that can be used?
- Or could you ask each year 6 teacher for information –
- if yes, how will you ensure a consistency of approach?
Record these judgements in the next 3 columns of the grid (see opposite).
3b. User defined categories – to identify any school-specific issues you might want feedback on
Entering the ‘User defined’ data:
- User Defined #1: enter a ‘y’ if the student is a member of this #1 subgroup, leave blank if not;
- User Defined #2: Repeat if the student is a member of the #2 subgroup (but read below for guidance)
Guidance:
It’s up to the school to decide whether it wishes to use these ‘User defined’ categories.
If you do, it will be up to the person overseeing the data collection to decide what these ‘User defined’ categories are.
For example:
- Suppose you have a suspicion that students from a particular ethnic background are under-performing their peers, you could choose that as one of your user defined options;
- Or you might be interested in looking at the learning behaviours of those students who survived lockdown relatively unscathed compared with their peers;
- Or you might have another issue that would be of interest to you!
Decide if you wish to take advantage of the ‘User Defined’ option. If yes, decide what the criterion is for each of the ‘User Defined’ options.
Enter the data in the final 2 columns of the sheet – see opposite.
3c. Entering the data in the class spreadsheet
Open the spreadsheet for your class, navigate to the ‘data collection sheet’ tab, and enter the contextual data in columns Q to AB for all of your students.
Remember that, aside from your class name, all entries will either be a y (yes) or left blank.
Save the spreadsheet and give a copy to the person overseeing the data collection.

4. Collating the data into the master spreadsheet
The person overseeing the process should:
- Open the master spreadsheet, ensuring you are on the ‘data collection sheet’ tab;
- Open each class spreadsheet in turn, highlight the data in columns B to AB, right click, copy, and paste the data into the master sheet;
- Repeat with each year 6 class in turn, pasting the data for each class starting in the next empty row;
- Save this master spreadsheet.
5. Sending TLO your completed spreadsheet
Make a copy of the master spreadsheet you created in section 4 above, but in this new copy we suggest that you delete all of the student names. While the names may be of use for your internal in-school purposes, the names will be irrelevant to TLO’s analysis and the removal of student names anonomises the data and removes any confidentiality issues.
Of course you should keep a copy of your own Master spreadsheet with the student names in, just in case you want it later.
For example, you might want to interrogate this data against your end of year assessments in the future.
You could look at end of KS levels against learning behaviour data. For example, comparing the behaviour ‘scores’ with the final Maths grade. This means you would be looking at learning behaviours in relation to a particular aspect of the curriculum.
Email your completed master spreadsheet, with the names removed, to . . .
Include in this email whether / how you have decided to use the ‘User Defined’ categories.
Equally, let us know if any of the columns are irrelevant – for example you may not identify G&T students and hence the whole column will be empty and can be ignored in the analysis.
Thank you for agreeing to take part in this research. When we have received the results from all the participating schools we hope to be able to report on the findings within one month.
Comments are closed.